Keeping databases running consistently and continuously is crucial to many organizations. When your site or application fails to load because of problems with your databases, you risk losing revenues—especially a business with a high traffic site which is the main source of revenues. If it happens often enough, you’ll lose not only transactions but customers.
There are many reasons why a database system may be unavailable, or at least not consistently available. It could be straightforward problems with your databases, or it could be hardware limitations. There are several potentially weak components of a database system. It’s important to know where are the potential weak points and to have a clear sense of what’s required to maintain a highly available database system.
If this concept is moderately new to you, it may be overwhelming. However, please understand that it’s achievable and learnable. You can start by focusing on one component, one area of potential weakness and then move on to strengthening the next. Start by determining what you have, how it’s configured, how it can be improved, and then try making some changes. For many changes, the results will show nothing but will prevent server problems later.
Checking Memory
Let’s go through some of the hardware vulnerabilities that can potentially cause problems for your databases. A common problem that will disable MySQL is not enough memory (i.e., RAM). You can see how much memory you have, how much is used and how much is free with the Linux command, free:
free -wh

      total  used  free  shared buffers cache available
Mem:  1.8G   783M  120M  54M    0B      933M  793M
Swap: 1.0G   185M  838M
This command will tell you how much RAM is on the server, but also how much swap space has been allocated. You may discover you don’t have enough memory available. In which case, you may need to add more RAM. You might discover you haven’t enabled swap space. If so, enable it. Incidentally, the options -wh are not available for all versions. As an alternative to using free, you could read
the contents of the /proc/meminfo file.
At a minimum, MySQL will need RAM for storing the grants tables, as well as caching the information_schema for the server and for every session. It needs memory for many things. If there’s no RAM available for any of this, it will lock MySQL.
Checking Hard-Drives
The next potential hardware problem is the hard-drive. To check how much hard-drive space you have available, you can use the df command like so:
df -h

Filesystem  Size  Used  Avail  Use%  Mounted on
/dev/xvda2  500G  169G  332G   34%   /
A full hard-drive can cause problems for MySQL. For instance, when MySQL executes SELECT statements that use ORDER BY or GROUP BY clauses, it will retrieve all of the rows from the storage engine and then create a temporary table to store the results before sorting or grouping the data. It will store that temporary table in RAM—if there’s enough memory available to hold it. Otherwise, it will store the temporary table on the hard-drive in a temporary directory (see tmp_dir variable for the location). This is slower but necessary for large amounts of data. If there is very little RAM available, it may have to write to the hard-drive for every query. That will greatly reduce performance. However, if the hard-drive is full, it will not be able to create temporary tables. This will also cause MySQL to lock.
There are other hardware considerations for maintaining MySQL high-availability of a database system, such as using better quality hard-drives, checking your CPU usage (try the top utility for this) and network equipment and configuration. Making sure you have good equipment and that MySQL has enough room in which to work is the first step in ensuring MySQL high-availability.
Monitoring
There is one thing with which you should be aware when using the command-line utilities mentioned: they provide static results—they only tell you the state of the server at the time they’re executed. If you run out of memory or hard-drive space during the night while you’re sleeping, your database system will be down. The problem might be resolved by the time you wake, but you will be unaware that it occurred, although your customers in other time zones may be very aware that there was a problem. Unfortunately, you can’t count on customers to tell you when there is a problem. You need a method to monitor these key hardware components.
You could write a set of shell scripts to check regularly the server using several command-line utilities and record in a log file when values exceed certain levels. That might work well, but it’s a lot of trouble to create such scripts to check everything. If you want to have alerts sent to you when there are problems, and if you want to track usage so that you can watch for trends, that’s, even more, programming work. All of this, though, is easy to do with Monyog. If you don’t have it already, consider downloading it.
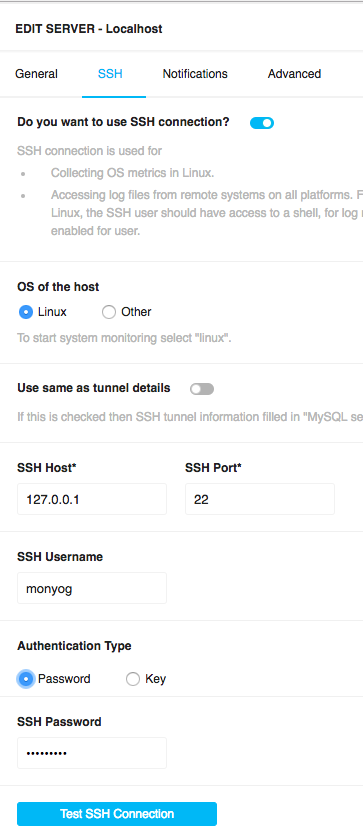
If you have Monyog installed on your server, open it in your web browser and click on Servers in the left margin. Look for the box for your server—probably labeled, localhost. There will be ellipses on that box, indicating more options. Click on the ellipses and you’ll see a list of choices. Choose Edit Server (see screenshot). If this isn’t a new installation, you probably have the server configured already for MySQL. You just need to enable SSH to be able to use the Linux monitor group. So click on the SSH tab and then the switch to enable it. Choose the OS system used—we’re assuming Linux for this article. If Monyog is installed on the server which is running MySQL, try using 127.0.0.1 for the host. Port will probably be 22. Next, enter the username for ssh. If you’re using Amazon’s AWS, it might be something like ec2-user. Monyog can authenticate with a key, but it has to be an OpenSSH key. Monyog can also authenticate with a password, but you may have to edit /etc/ssh/sshd_config and set PasswordAuthentication equal to yes. When you’re finished, click on Test SSH Connection. If it works successfully, click Save. For this to work, you will need to have a user named, monyog on the Linux filesystem and that user will have to have access to the /proc directory and should be in the same group as the mysql user. If you already have Monyog running and monitoring MySQL, all of this is probably already done.
Now you’re ready to enable the Linux monitor. Click on Monitors in the left margin. Then click on the icon at the top right for managing monitor groups—it looks like a list of bullet items. There will be a list of group choices for what Monyog will monitor. Scroll down and enable Linux, and then Save. Now Monyog is monitoring several things on your Linux server.
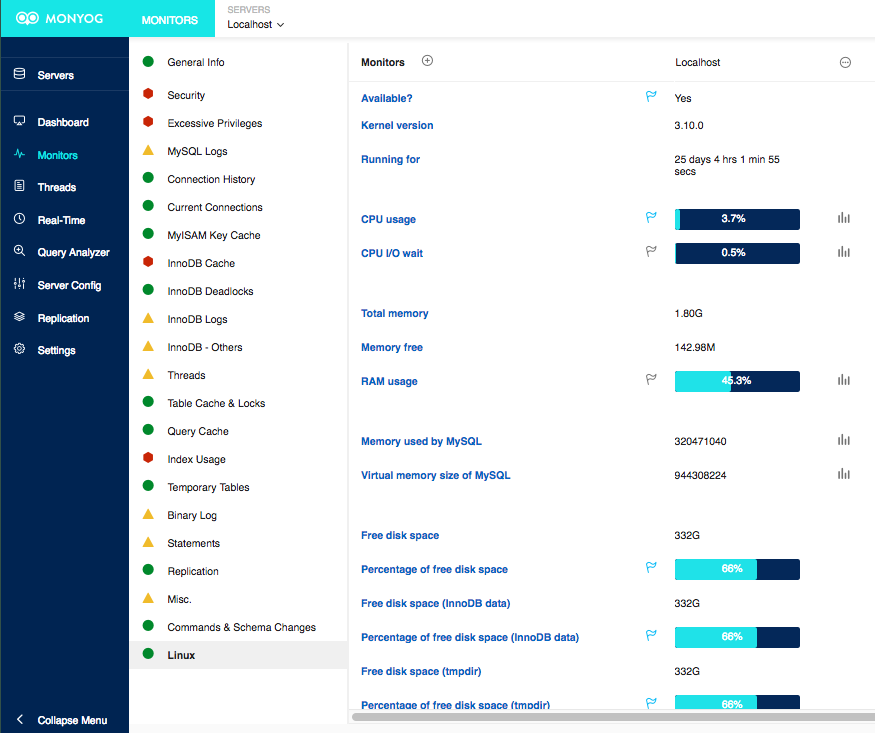
While still on the Monitors page, click on the Linux monitor group—it’s probably at the bottom of the list of monitor groups (see screenshot). You’ll then be able to see plenty of information on the server: CPU usage, total memory, memory used and available, swap memory, and hard-disk space. You can also see how much memory MySQL is using. If something isn’t being monitored on the server, you can click the plus-sign next to the heading, Monitors to add a monitor. You will need to enter the command and settings for Monyog to collect the information.
Looking again at the Linux monitor group, if you click on the small bar-graph icon for a particular monitor, you can see a graphical representation of the information over time. This will help you to spot trends. If you click on the flag icon for a monitor, you can have Monyog send you an email or an SNMP trap to alert you when it exceeds parameters you set. This will allow you to detect a threat to the high-availability of the database servers so you can have time to resolve a problem before there can be a loss of service.
Conclusion
Achieving high-availability for database servers can require some work and vigilance for a DBA. There are many tools built into Linux and other operating systems that can help. You can monitor the common culprits that threaten high-availability, either manually or by creating your own shell scripts or programs. Monyog can make all of this easy—and you can implement it today, with very little effort and no programming.
Once you’ve made sure you have good equipment, that’s it’s configured properly, and you’re monitoring system usage, including alerts for when parameters you set are exceeded, you’re ready to consider the next component in maintaining high-availability: multiple servers. We’ll look at that option in the next article in this series on high-availability.


