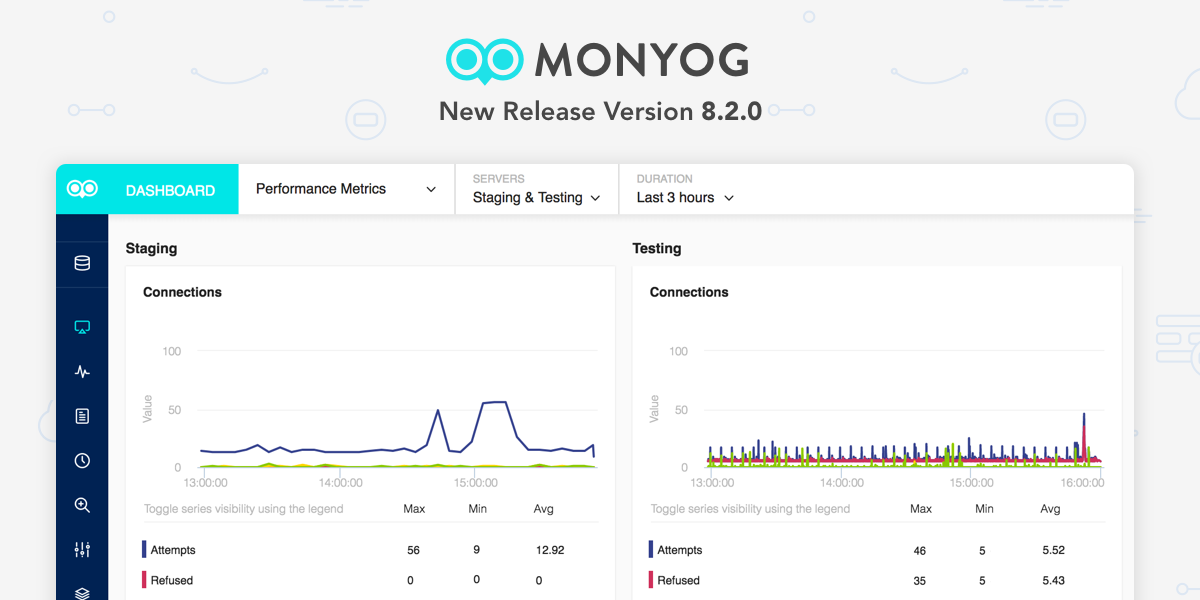
This release includes some GUI improvements and also fixes a few (also mostly GUI-related) bugs. Additionally, we have upgraded most libraries used internally to the current version. This – most significantly -includes OpenSSL.
Changes as compared to Monyog MySQL Monitor 8.1.1 include:
Features:
- Added option to have same Y-axis scaling for Dashboard charts across all servers.
Bug Fixes:
- Query count could return negative value in Overview page due to integer overflow.
- The History/Trend analysis chart for the counter “Free disk space” was not rendering properly.
- The Monyog API for enabling System metrics for RDS instances was not working as expected.
- After zooming into the real-time chart, the Query column was not getting sorted.
- History/Trend could show wrong value for some counters – mainly string based counters.
- In case of RDS servers, rebuild of a server’s database, restarting Monyog or using “editserver” API could stop the collection for OS metrics.
- When using cname for RDS servers, Monyog failed to enable system metrics.
Miscellaneous:
- Redesigned Time-selector for all the features.
- Upgraded OpenSSL to current v1.0.2l. The version used before had a few non-critical security issues. Also quite a lot of libraries used internally were updated.
You can download a 14-day free trial of Monyog here.
Purchase Monyog: https://webyog.com/product/monyogpricing


