Monyog (SQL Diagnostic Manager for MySQL)
Find, analyze and fix MySQL performance problems with powerful monitoring tools
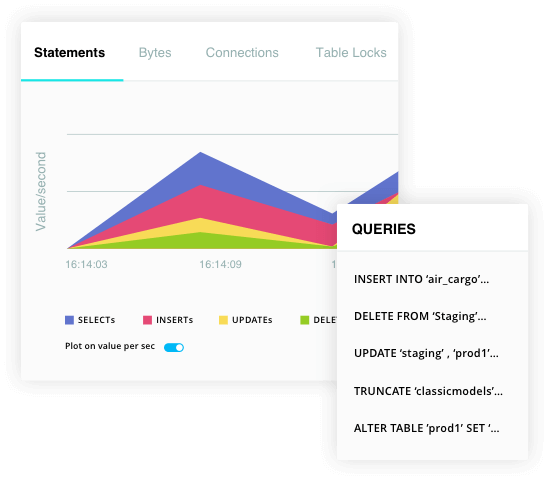
Real-time monitoring
Know what’s happening right now on your servers.
Monitor each query in real-time and identify what is causing a sudden or unwarranted spike in your MySQL databases. Real-time monitoring helps you take corrective action and resolve major issues even before it hits your end users.
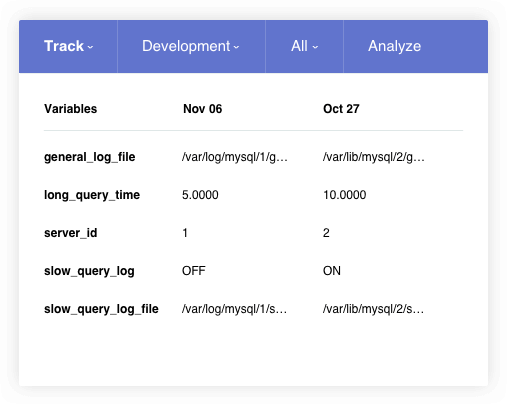
Track MySQL Configuration Changes
Find the cause of performance issues.
Track all changes done to the MySQL Global variables using the configuration management. You can track and compare changes to the configuration file and identify the reason for performance issues.
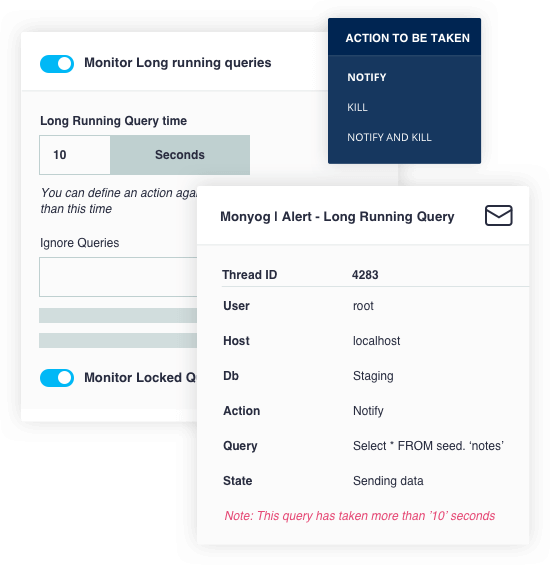
Monitor Locked & Long Running Queries
Reduce excessive CPU usage and query execution time.
Monitor locked and long running queries in real-time. Get notifications on mail or SNMP traps for queries that take more than a specified amount of time to execute. You also have the option to configure Monyog to kill, notify or notify & kill such queries.
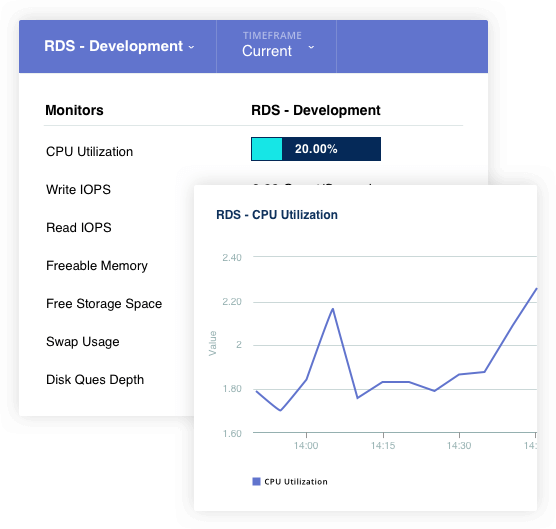
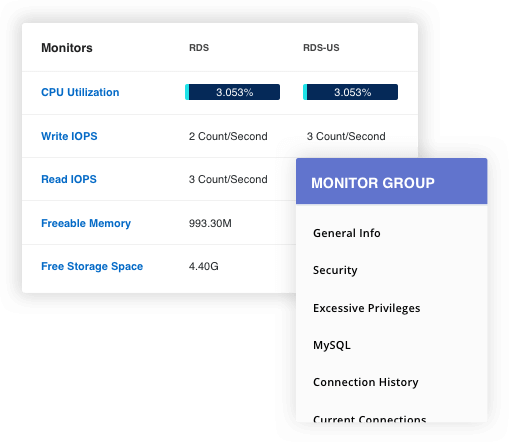
RDS OS and file-based log monitoring
Monitor hosted MySQL like RDS/Aurora.
Monyog showcases General Query, Slow Query and Error logs in a single view by making use of the RDS REST API. Monyog lets you view RDS OS metrics like CPU Utilization, RAM usage etc. using the CloudWatch API.
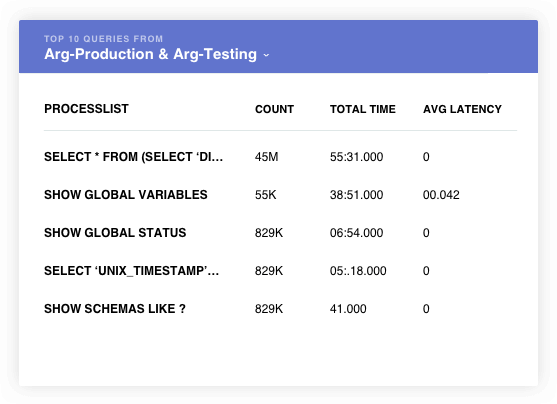
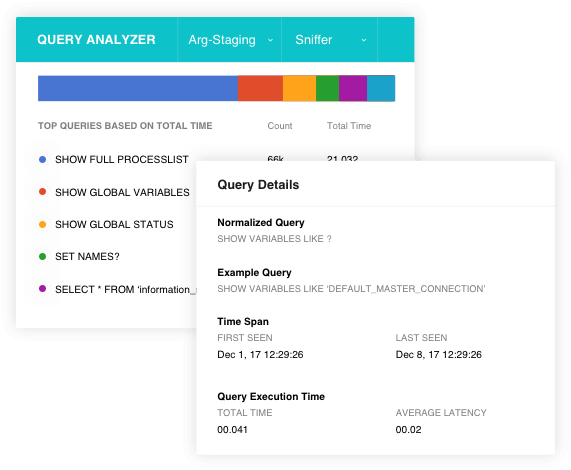
Find top 10 queries across servers
Quickly identify queries that cause performance issues.
Monyog lets you find top 10 queries across servers based on the total execution time to help improve MySQL query performance. Visualize critical alerts and warning alerts across servers to figure out the cause of performance issues.
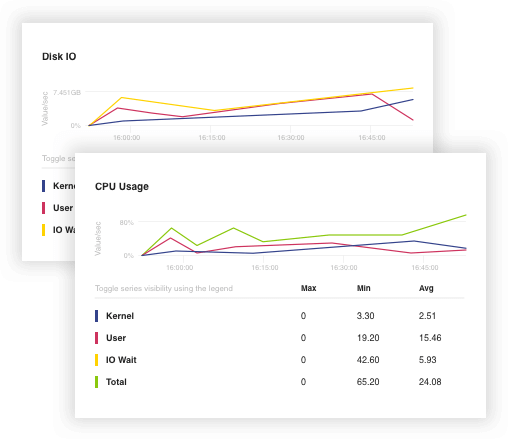
Custom Dashboard & Charts
Spot database performance patterns & trends.
Customize dashboard and charts as per your MySQL monitoring requirements. You can expand a particular chart to identify a sudden/unwarranted spike and the queries responsible for the spike. Monyog provides details on queries to debug an event that took place in the past.
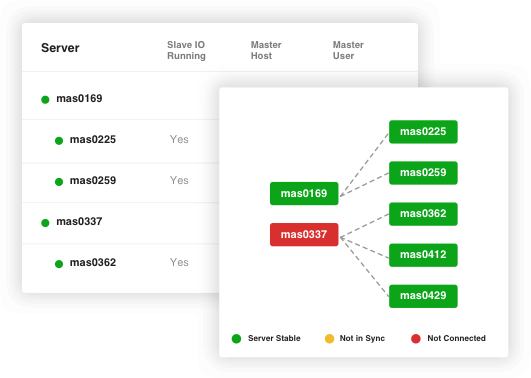
MySQL Replication Topology View
Multi-master and Multi-source replication.
View the replication hierarchy of servers along with details of each replicated server to make sure the data are always up to date. At any time, you can switch from graphical to tabular replication view to get a deep dive into the running servers.
600+ Best Monitors & Advisors
High-availability, monitoring, alerts and SNMP traps.
Get quick access to 600+ monitors & advisors that continuously check the health status of your MySQL servers. Monyog will send alerts & traps in-case a monitor crosses the set critical and warning threshold value.
Sniffer based Query analyzer
Find the problematic MySQL queries.
Monyog fetches queries from MySQL server using three methods: Processlist, Performance schema and MySQL proxy. Sniffer stores all the historical data in the embedded SQLite repository and helps you find any database problems occurred in the past.
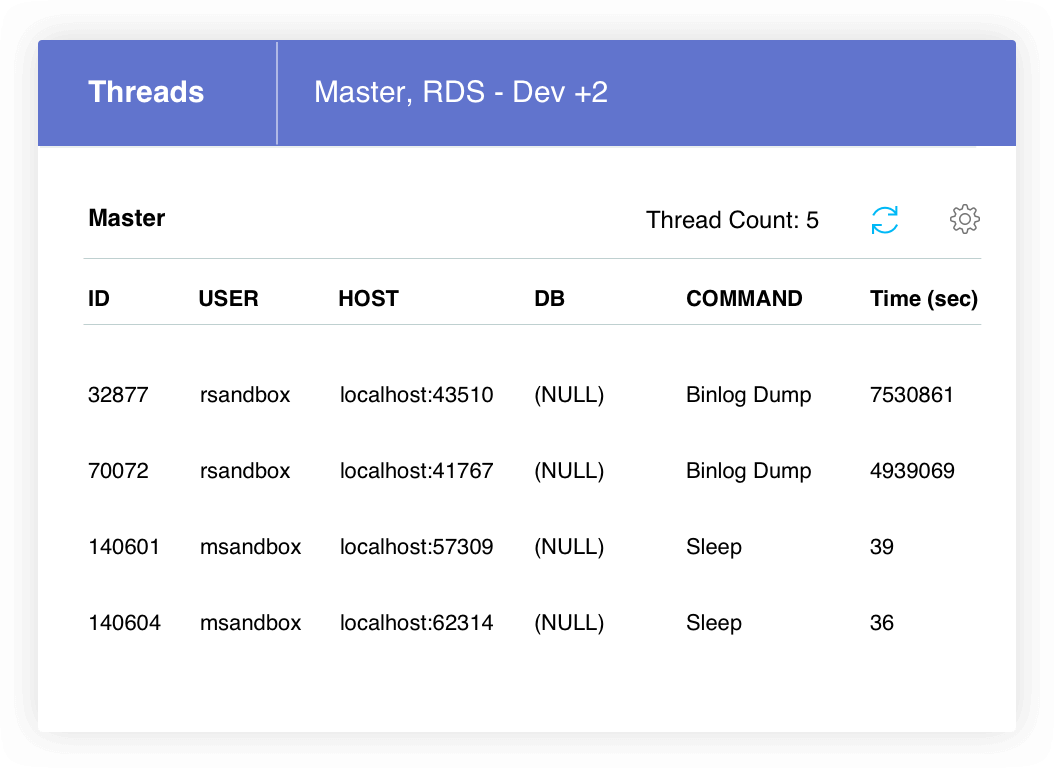
Threads
Get the details of MySQL queries that are executed.
Finding what keeps your servers busy is an important part of database monitoring. Monyog shows the number of threads currently running on your MySQL server and the output of SHOW FULL PROCESSLIST.warning threshold value.